Leave Your Message
Choosing the right equipment in 2026 requires more than comparing catalog heat-transfer rates. Heat Exchanger Efficiency depends on thermal duty, pressure drop, fouling behavior, maintenance access, material selection, and operating conditions. A polished datasheet can still hide costly performance losses.
Professor Sadik Kakaç, a respected heat-transfer researcher, has emphasized that “the best heat exchanger is not necessarily the one with the highest heat-transfer rate.” That principle matters for global buyers. A plate exchanger may deliver impressive compactness, while a shell-and-tube unit may offer easier cleaning in a demanding process. Neither choice is automatically superior.
Real conditions decide.
This guide examines efficiency through measurable operating details. Buyers should compare the logarithmic mean temperature difference, overall heat-transfer coefficient, approach temperature, pressure loss, and fouling allowance. Energy recovery, pump requirements, and expected service life also deserve equal attention. A unit that saves heat but consumes excessive pumping energy may not provide genuine efficiency.
Field experience often reveals uncomfortable gaps between laboratory figures and plant results. Water quality changes. Flow rates drift. Maintenance schedules slip. Even a carefully sized exchanger can underperform after months of deposits.
That is the part many purchasing guides understate.
The following sections provide a practical framework for evaluating suppliers, technologies, materials, and lifecycle costs across international markets. Some recommendations will remain conditional, because process fluids, climate, standards, and installation quality vary widely. Buyers should verify every critical claim through test data, references, and independent engineering review before making a final decision.
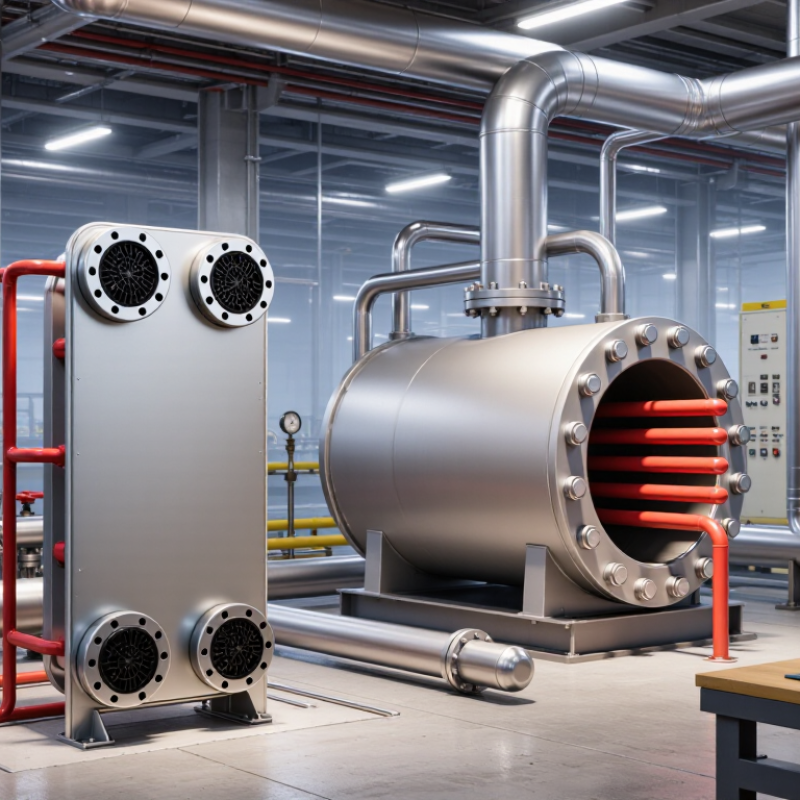
Heat exchanger efficiency begins with a simple task: moving heat without wasting pressure, area, or energy. A hot fluid transfers energy through a wall to a colder fluid. The wall must conduct heat, while flow must reach enough surface contact. Engineers often describe performance with the overall heat transfer coefficient and temperature difference. Higher values can reduce required surface area, but they do not guarantee lower operating costs. Pump power, fouling, leakage, and control quality also matter. Small details matter.
In field inspections, a clean exchanger may perform well during commissioning, then decline after months of deposits. Scale adds thermal resistance and can narrow channels, increasing pressure drop. Flow imbalance creates another hidden loss. One side may leave colder than expected, while the other side remains underused. Counter-current flow usually supports a stronger temperature driving force than parallel flow. Still, the best arrangement depends on fluid properties, allowable pressure loss, maintenance access, and safety requirements. A perfect calculation can fail when real flow conditions differ. That is worth checking.
Tips: Record inlet and outlet temperatures, flow rates, and pressure drops during stable operation. Compare actual heat duty with the design value, not just the outlet temperature. Inspect for fouling patterns and air pockets before changing equipment size. Leave access for cleaning. Use measured data to adjust the model. When uncertainty remains, state it clearly and test one variable at a time.
| Evaluation Dimension | Fundamental Definition or Formula | Typical Engineering Data | Efficiency Implication | Buyer Verification Point |
|---|---|---|---|---|
| Heat-Duty Capacity | Q = ṁ × Cp × ΔT | Reported in kW or MW; depends on mass flow, specific heat, and required temperature change. | A correctly sized exchanger transfers the specified duty without excessive surface area or utility consumption. | Confirm design duty, inlet and outlet temperatures, flow rates, fluid composition, and operating cases. |
| Thermal Effectiveness | ε = Actual heat transfer ÷ Maximum possible heat transfer | Always between 0 and 1; many properly designed liquid-to-liquid systems operate approximately between 0.60 and 0.90. | Higher effectiveness generally improves heat recovery, but may require more area, passes, or pressure drop. | Request the guaranteed effectiveness at the specified flow rates and fouling condition. |
| Log Mean Temperature Difference (LMTD) | ΔTlm = (ΔT1 − ΔT2) ÷ ln(ΔT1 ÷ ΔT2) | The temperature driving force varies with flow arrangement; counter-current flow usually provides a larger average driving force than co-current flow. | A larger effective temperature difference can reduce the required heat-transfer area. | Check terminal temperature differences and the correction factor for multipass or crossflow arrangements. |
| Overall Heat-Transfer Coefficient (U) | Q = U × A × F × ΔTlm | Typical clean-design values vary widely: approximately 100–1,500 W/m²·K for many liquid systems; gas systems are commonly much lower. | Higher U can reduce surface area, but it depends on fluid properties, geometry, velocity, wall resistance, and fouling. | Compare both clean and fouled U-values using the same units and design assumptions. |
| Number of Transfer Units (NTU) | NTU = U × A ÷ Cmin | NTU is dimensionless; increasing NTU generally increases effectiveness, with diminishing gains at higher values. | Useful when outlet temperatures are not fully known or when comparing alternative exchanger configurations. | Request the effectiveness–NTU calculation and the heat-capacity-rate ratio, Cr. |
| Heat-Capacity-Rate Ratio | Cr = Cmin ÷ Cmax, where C = ṁ × Cp | Cr ranges from 0 to 1; a low ratio can permit one fluid to undergo a larger temperature change. | The ratio affects the maximum achievable effectiveness and the selection of flow arrangement. | Verify mass flow and specific heat at actual operating temperatures, not only at reference conditions. |
| Pressure Drop | Pressure loss caused by friction, changes in direction, ports, passes, and fittings. | Common preliminary allowances are often about 20–100 kPa per side, but the acceptable value is process-specific. | Higher velocity can improve heat transfer but may increase pumping or fan power and erosion risk. | Obtain pressure-drop guarantees at minimum, normal, and maximum flow conditions. |
| Fouling Resistance | Additional thermal resistance caused by deposits, scaling, corrosion products, biological growth, or process contamination. | Design fouling factors vary by fluid and standard; water-service values are commonly specified in m²·K/W and must be selected from service data. | Fouling lowers the operating U-value and can increase pressure drop as passages become restricted. | Review water chemistry, suspended solids, scaling tendency, cleaning frequency, and access for inspection. |
| Flow Arrangement | Counter-current, co-current, crossflow, or multipass flow determines the temperature profile. | Counter-current arrangements can approach the inlet temperature of the opposite stream more closely than co-current arrangements. | Flow arrangement strongly affects temperature recovery, area requirement, and controllability. | Confirm the actual flow path, pass arrangement, temperature cross limits, and correction factors. |
| Velocity and Flow Regime | Reynolds number: Re = ρvDh ÷ μ | Higher Reynolds number generally increases turbulence and convective heat transfer, subject to erosion, vibration, and pressure-drop limits. | Insufficient velocity may promote fouling; excessive velocity may increase power consumption and mechanical damage. | Request channel velocities, Reynolds numbers, erosion assessment, and minimum turndown performance. |
| Heat-Transfer Surface Area | A = Q ÷ (U × F × ΔTlm) | Required area increases when duty rises, temperature driving force falls, U decreases, or fouling allowance increases. | Oversizing can increase capital cost and low-load fouling; undersizing can prevent the required duty. | Check design margin separately from fouling allowance and confirm performance at part load. |
| Material Compatibility | Material selection must account for temperature, pressure, pH, chlorides, dissolved gases, erosion, and galvanic effects. | Corrosion resistance is service-specific; no single material is optimal for every fluid or temperature range. | Compatible materials preserve wall integrity and maintain thermal performance over the operating life. | Provide a complete fluid analysis and verify material certificates, corrosion allowance, and galvanic compatibility. |
| Mechanical Design Limits | Allowable operating pressure and temperature must remain within the exchanger’s design ratings. | Pressure and temperature ratings depend on construction, materials, geometry, codes, and joining method. | Safe operation prevents leakage, deformation, thermal fatigue, and unplanned shutdowns. | Review design pressure, design temperature, vacuum rating, differential pressure, cyclic duty, and applicable codes. |
| Cleanability and Maintenance | Maintenance strategy includes mechanical cleaning, chemical cleaning, inspection, gasket replacement, or bundle access. | Required cleaning interval depends on fouling rate, fluid quality, operating temperature, and velocity. | Easy access can reduce downtime and restore thermal performance before significant duty loss occurs. | Compare access requirements, spare parts, cleaning method, isolation needs, and estimated maintenance hours. |
| Energy and Life-Cycle Cost | Total cost includes purchase, installation, pumping or fan power, utilities, cleaning, repairs, and replacement. | A design with lower initial cost may have higher operating cost if it causes excessive pressure drop or rapid fouling. | The most efficient option minimizes lifetime energy and maintenance cost while meeting process requirements. | Compare net present cost using the same duty, utility prices, operating hours, maintenance assumptions, and service life. |